

Hello Aspirants, In this Data interpretation quiz we are providing a set of data interpretation based on IBPS Clerk 2018 Mains memory based paper . As you know Data interpretation section plays a vital role in examinations like SBI PO, SBI CLERK, IBPS PO, IBPS CLERK etc. But if you practice more and more you can easily crack this section and get good marks. So keeping this in mind try to solve these Data Interpretation questions and also try to measure how much time you are taking to completely solve this level of questions.
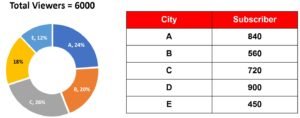
Direction (1-5): Given pie chart shows percentage distribution of viewers of a Tv channel in five different Cities (A, B, C, D & E) and table shows number of viewers who subscribed the channel. Read the data carefully and answer the questions.
Note: Total viewers = Total subscriber + Total unsubscribe
1. If 15% subscriber from city A unsubscribe the TV channel and 5% nonsubscriber from City C become the subscriber of the TV channel then find total number of nonsubscriber from city A is what percent more or less than the total number of subscriber from city C?
A.9.56% less
B.4.95% more
C.4.33% less
D.4.72% less
E.5.21% more
[su_spoiler title=”Answer” style=”fancy” icon=”plus-circle”]D.4.72% less[/su_spoiler]
2. Average number of nonsubscriber is how much more or less than the average number of subscriber from all the five cities?
A.172 less
B.188 less
C.210 less
D.145 less
E.198 less
[su_spoiler title=”Answer” style=”fancy” icon=”plus-circle”]B. 188 less[/su_spoiler]
3. If total male unsubscribed viewer in city C is 331/3% more than that of female unsubscribed viewers then find ratio of total male unsubscribed viewers in city C to total unsubscribed viewers in E & D together?
A.14 : 15
B.16 : 13
C.15 : 16
D.16 : 15
E.13 : 16
[su_spoiler title=”Answer” style=”fancy” icon=”plus-circle”]D. 16 : 15[/su_spoiler]
4. Find difference of central angle between city B and D?
A. 3.6
B. 12.2
C. 5.5
D. 5.4
E. 7.2
[su_spoiler title=”Answer” style=”fancy” icon=”plus-circle”]E. 7.2[/su_spoiler]
5. Find the central angle for total subscribed viewers in city A & E and total unsubscribed viewers in city B & C together with respect to total viewers?
A. 153.2
B. 188
C. 166.2
D. 172.6
E. 133.4
[su_spoiler title=”Answer” style=”fancy” icon=”plus-circle”]C. 166.2[/su_spoiler]
[su_heading size=”16″ align=”left”]Detailed Video Solution[/su_heading]
[su_youtube_advanced url=”https://youtu.be/G6ygdrOdehE” fs=”no” modestbranding=”yes” title=”Detailed Video Solution “]


